Abstract
Current collaborative mapping projects using locative media technologies have often overlooked the conventions of the base map as a site for reinvention. Although these projects are ambitious in their aim to propose alternative organizations of urban space through the way it is digitally mapped, they remain bounded by datasets that reinforce a Cartesian and static notion of urban space. This paper questions the methodology of the base map as it is utilized in these projects, and proposes alternative approaches for mapping the city. Specifically, it looks at the city as a space of events, defined by the ways in which it is used rather than the orthogonal geometry by which it is constructed; and highlights several key examples from the history of urban planning and art practice that provide models for such alternative mapping strategies. By focusing on the limitations of the base map, I hope to provoke new ideas for these emerging projects.
Collaborative Mapping
As the technologies of locative media develop, they have engendered a series of projects that utilize GPS (Global Positioning Systems), wireless networks, and mobile technologies to augment space with its digital double of media annotations. Among these, collaborative mapping projects have proposed to use location-sensing technologies to create a shared interpretation of urban space. Admirably, they offer tools with which to gather multiple perspectives of place – escaping the margins of tourist guidebooks and visitor maps – to enable a collective memory in which, in the words of Giles Lane, "ordinary citizens embed social knowledge in the new landscape of the city."[1] As the strategies of this vision are defined, the code is written, and the geographic data sets are collected, it is crucial that we examine the strategies of mapping itself; including not only what is mapped but how.
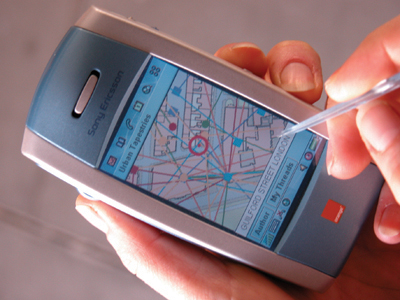
Figure 1. Urban Tapestries mobile phone interface. Photo: John Paul Bichard.
© Proboscis 2004. http://urbantapestries.net
Figure 2. Urban Tapestries PDA interface. © Proboscis 2003. 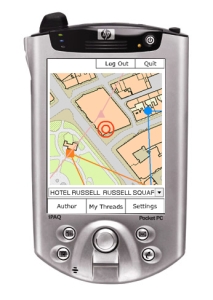 Many of the first forays into collaborative mapping projects, including Urban Tapestries[2] [Fig. 1, Fig. 2] and PDPal [3], layer annotations upon common base maps. These base maps are conventional street grids analogous to the information displayed by a Google Map or a MapQuest search.[4] They draw from common digital data sets, such as the U.S. Census Bureau’s TIGER databases,[5] to represent the city. Based on user queries, maps that depict static geographic landmarks including road systems, transit routes, block plans, and popular destinations are produced. Undeniably, this version of the base map is a common reference. The spatial hierarchy of the street map is reinforced by the daily practice of navigating a new city, finding a subway stop, or an unfamiliar address. However, embedded in these everyday references is a set of assumptions that order our perceptions of physical space. As Geographer Dennis Cosgrove describes, "Cartography acts not merely to record the various ways that the city is materially present, but as a creative intervention in urban space, sharpening both the physical city and the urban life experienced and performed there."[6] Although many collaborative mapping projects undermine their own base maps by layering them with collectively defined concepts of space; including participants’ emotions, itineraries and memories, these annotations are inextricably linked to the predefined foundations of the map they overlay. Many of the first forays into collaborative mapping projects, including Urban Tapestries[2] [Fig. 1, Fig. 2] and PDPal [3], layer annotations upon common base maps. These base maps are conventional street grids analogous to the information displayed by a Google Map or a MapQuest search.[4] They draw from common digital data sets, such as the U.S. Census Bureau’s TIGER databases,[5] to represent the city. Based on user queries, maps that depict static geographic landmarks including road systems, transit routes, block plans, and popular destinations are produced. Undeniably, this version of the base map is a common reference. The spatial hierarchy of the street map is reinforced by the daily practice of navigating a new city, finding a subway stop, or an unfamiliar address. However, embedded in these everyday references is a set of assumptions that order our perceptions of physical space. As Geographer Dennis Cosgrove describes, "Cartography acts not merely to record the various ways that the city is materially present, but as a creative intervention in urban space, sharpening both the physical city and the urban life experienced and performed there."[6] Although many collaborative mapping projects undermine their own base maps by layering them with collectively defined concepts of space; including participants’ emotions, itineraries and memories, these annotations are inextricably linked to the predefined foundations of the map they overlay.
In its 20th-century configuration, the base map is a purely geographic categorization of urban space, defined by the Cartesian coordinates, the road system, and the block plan.[7] As a pedestrian tool, it provides a means of orientation as a way-finding device, listing street and district names, landmarks, parks, etc. It also has a regulatory function, describing property lines and zoning boundaries. Like any map, the contemporary base map inscribes a conception of the landscape. Jean Baudrillard’s adage that "it is the map that precedes the territory"[8] is especially relevant. The cartographic conventions of the base map are an expression of a singular notion of urban space – one that favors the street over the route, the static over the temporal, and the formal over the subjective. As locative media projectsix are created that build upon the datum of common base maps, they are structuring a collaborative notion of space within this predefined conception of the city.
Moving Beyond the Grid
As locative projects seek new ways to interpret the landscape through collaborative mapping, there is an opportunity to promote an alternative to the convention of the base map that avoids reinforcing our current notions of cartography. Towards this end, there are some important questions to consider that may help to define potential directions for these projects by reflecting on the modalities they omit. Firstly, can we consider mapping the city through its use patterns, rather than illustrating it as an assembly of static landmarks? Is it possible to invert our notion of the city to foreground the fluctuating patterns of occupation and abandonment? Is it possible to repopulate the map to emphasize the rhythms of urban life rather than just the spaces in which they occur? Can we use wireless technologies to reflect back on themselves, revealing the emerging hybrid landscape of the material and the "Hertzian,"[10] as WiFi nodes are installed, wireless devices deployed, and adhoc networks [11] formed? Finally, how should we associate the ephemeral events of the city in order to understand them as an evolving set of relationships?
Historically, urban theorists have envisioned the city as a space that is constructed through the patterns of its occupation. In Kevin Lynch’s seminal book The Image of the City, published in 1960, he proposed that we understand urban space through the construction of mental maps. These maps are formed by our experiences of navigating urban space, including the temporary events that activate the life of the street. Lynch describes "Moving elements in a city, and in particular the people and their activities, are as important as the stationary physical parts […] While [the city] may be stable in general outlines for some time, it is ever changing in detail."[12] More radically, Michel de Certeau proposed in his 1984 book The Practice of Everyday Life that the street is a place defined by urban planning but transformed into a space through the act of walking. He suggests that "space is composed of intersections of mobile elements. It is in a sense actuated by the ensemble of movements deployed within it. […] In short, space is a practiced place."[13] Michael Batty, in his 2002 essay for Environment and Planning, argues the need for a temporal emphasis in urban theory, analyzing the dynamics of urban change. He poses the question, "Is it possible to conceive of cities as being clusters of 'spatial events.’"[14] The interpretation of the city, articulated by these and other scholars, implies the development of an urban cartography that is generated by the shifting patterns of use rather than the stationary references depicted in conventional base maps.
Several key examples of alternative mapping techniques, in the history of urban planning and art practice, may inform the development of contemporary cartography. Although they are not templates for current mapping tools, they provide provocative precedents for redefining the base map. Specifically, they offer methods for representing the ways in which the city is traversed. The mobile is emphasized over the stationary in these maps, offering a way of understanding the city as a temporal system. In addition, the contours of the city are rendered through the routes of its inhabitants, inverting the standard visualization of a path plotted over the street-map used in current mapping software like Mapquest and Google Maps.[15] Ultimately, the geographic logic of the map is put into question, framing the experience of urban space according to a system of relations, rather than one’s position in the urban grid.
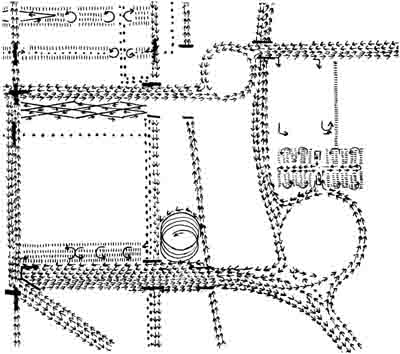
Figure 3. Louis Kahn's diagram of existing traffic movement for his Philadelphia Planning Study.[16]
Route
In 1953 Louis Kahn created a series of drawings illustrating traffic movement in Philadelphia.[17] [Fig. 3] Arrows, dashes, and crosses each mark the path and speed of cars, buses, trucks, and streetcars with varying speeds and destinations. However, the physical infrastructure of the city is not depicted. Rather, the street grid is only implied as a reversal of the use patterns of those who travel through it. The physical image of the city is dematerialized in favor of flow, speed, and movement. This inversion of space is repeated in Bill Hiller’s Axial Map of Greater London [18] [Fig. 4], in which the map represents the trajectories of movement through the city by drawing an axis between one spatial event and the next. Hiller’s map reinforces a subjective rendering of the city, basing its form on urban features like sight lines and patterns of occupation.
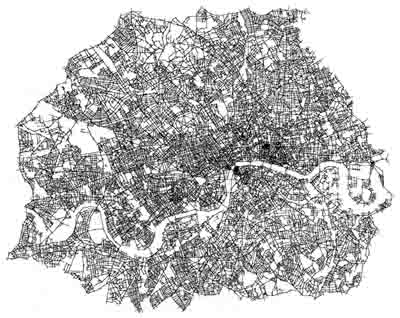
Figure 4. Bill Hiller's axial map of greater London.[19]
Several contemporary projects parallel this logic while making use of locative technologies, such as GPS devices, to track one’s trajectory through the city. Amsterdam Real Time [20], created by Esther Polak and the Waag Society, plotted the daily itineraries of sixty volunteers through Amsterdam over several months. Compiled into a collective map, the form of the city can be read through the accumulation of lines, articulating the curve of the urban plan and common thoroughfares. Sites that were frequented by the participants became worn on the map, brightening with frequent use, yellowing, and then turning red. This technique reoccurs in Cabspotting [21] but in this case focused on the exploration of transit routes. Currently under development by Scott Snibbe, Amy Balkin, and Stamen Design in collaboration with the San Francisco Exploratorium, Cabspotting traces the patterns of cabs as they travel through the San Francisco Bay Area, creating time-lapse maps that reveal the daily rhythms of the city. For example, some articulate the ebb and flow of the commute, while others represent the speed of the cabs – tracing their route with a line that turns from white to red as it transitions from downtown areas to the highway.
These maps, however, do not completely break with the hierarchy of the base map. The majority of them adopt the plan view instead of experimenting with alternate projections, such as the panoramic, horizontal, or three-dimensional perspectives that would emphasize the subjective nature of the route.[22] One exception is Flycab, where the open-source programming environment of Cabspotting has been used by artist Tomas Apodaca to generate a three-dimensional view. In addition, although the route is described with a series of symbols or traces, these markings do not imply the occupations of space as dramatically as they could. For example, 16th-century European maps attempted to magnify urban life by illustrating ships sailing into harbor, pedestrians on the streets, or carriages on the roads. They avoided strictly scientific surveys in favor of a loose depiction that described the nature of urban life rather than the delineation of urban space.[23] As the base map becomes repopulated with the dynamics of urban movement, can some of these historic techniques be reinterpreted? Could GPS tracking be used to amplify the real-time patterns of the city, in order to describe spatial events such as a parade or other gathering? For example, the volume or pitch of ambient audio could suggest patterns of density.[24] Enlarging everyday dynamics of urban space through the device of the map would perhaps compel us to maneuver through the city differently – being drawn or repelled by the ephemeral events that shape it.
The above examples, however, create a unique cartographic precedent by activating the route as a central generative device for mapping urban space. These maps are dynamically shaped by the ways in which the city is exploited by the people that traverse it. As new models of collaborative mapping are created, could they incorporate base maps that visualize the city as a temporal system characterized, as Batty suggests, by duration, intensity, and volatility? This view implies that the base map and the annotations layered upon it emerge from the way in which the city is inscribed through its daily patterns.
Typology
The Situationist maps, including Guy Debord’s Naked City [Fig. 5], present the most radical departure from the grid. In reaction to the rational city models embraced by Parisian postwar planners in the 1950s, he and his colleagues co-opted the map of Paris, reconfiguring the experience of the city through its authority. [25] By manipulating the map itself, they intervened in the logic of the city, constructing an alternative geography that favored the marginalized, and often threatened, spaces of the urban grid. Torn from their geographical context, these areas were woven together by arrows inspired by the itineraries of the drift or "dérive." These "psychogeographic" maps proposed a fragmented, subjective, and temporal experience of the city as opposed to the seemingly omnipotent perspective of the planimetric map. As mapping is used as a tactic to bring together personal narratives about urban space, the Situationist maps provide a useful example of visualizing a subjective view of the city.
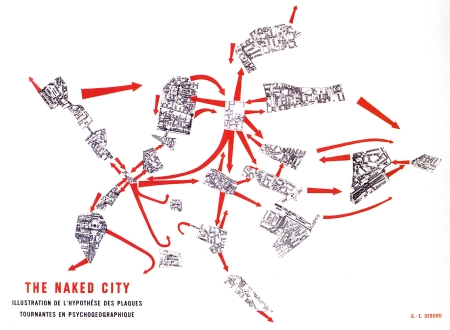
Figure 5. Guy Debord's 1957 map "The Naked City."[26]
The central problem with these maps is not in the way in which they confront norms of cartography, but the duration to which they are bound. The ephemeral nature of psychogeographic space meant that these sites could quickly shift through the pressures of development. The Situationist maps in turn become an archive of a specific moment in the life of the city. However, if these maps incorporated time, they would be able to show the migration or disappearance of these psychogeographic spaces, highlighting and critiquing the urban trends that were / are shaping the city.
Although the Situationists most likely regarded these maps as a record of the drift and a means for provoking new tactics for inhabiting the city, they also represent a valuable schema for creating new forms of cartography. These maps uniquely propose a networked model in which spatial events are abstracted from the grid and linked according to their typology. As databases form the engines of the contemporary base map, the information they contain may be retrieved in multiple configurations, allowing for a range of methods for visualizing the space of the city. The vocabulary of geo-spatial metadata behind the contemporary base map should be expanded to include a broader set of terminologies, allowing for new interpretations of the urban landscape. For example, querying space according to ambient phenomena such as its emotional associations or pollution levels.[27] As suggested by Kevin Lynch, visualizing urban space as a montage of typologies may in fact be closer to the fragmented way in which we create our own mental maps. Perhaps we can begin to use database driven maps to understand place within a system of relations determined by their relevance to our queries, rather than their geographic location.
Flux
Wireless networks and mobile devices are radically reforming our contemporary notions of urban place. As the traditional architectural definitions of public and private are blurred by the infiltration of portable electronics and the invisible edges of wireless connectivity, the dynamics of the urban environment grow progressively more complex. Although they are not physically obvious, these varying boundaries have profound implications for our notion of the space of the city. They suggest a changing model of urban reference that is modified not only by patterns of communication, but also by zones of connection and disconnection. Mobile phone connectivity, WiFi access, and adhoc networks generate a series of boundaries that continually reconfigure urban space. They may create density in public spaces by overlaying free access [28] or marginalize urban areas so that they become known as "dead zones" in the connective tissue of mobile communication.[29]
Hertzian space has a significant effect on the way we occupy the physical space of the city – avoiding dropped calls in tunnels, finding locations with strong signal to use a cell phone, or a WiFi hotspot to check e-mail are familiar examples. Emerging practices like being "bluejacked"[30] with an unsolicited message on your mobile phone or otherwise having your travels augmented by annotations, advertising, and other information are further examples.[31] As our notions of physical space become increasingly informed by the fluctuating boundaries and data transmissions of wireless technologies, our traditional points of urban reference also shift.[32]
Landscape architect James Corner describes the power of maps to render these hidden landscapes: "[Mapping’s] agency lies in neither reproduction nor imposition but rather in uncovering realities previously unseen or unimagined. […] The capacity to reformulate what already exists is the important step. And what already exists is more that just the physical attributes of terrain (topography, rivers, roads, buildings) but includes also the various hidden forces that underlie the workings of a given place."[33] As contemporary mapping projects using mobile devices and wireless networks chart new dimensions to the city, could they reconfigure the base map to register the invisible topography of Hertzian space?
Ben Hooker and Fiona Raby’s maps of cellular networks in Helskini are a good example of an experiment in surveying the borders of this hybrid landscape. [34] [Fig. 6] In 1998, the team from the Royal College of Art in London set out to investigate the possibilities for recreational mobile phone use in Helsinki, Finland, for their Project# 2615-FLIRT: Flexible Information and Recreation for Mobile Users. They determined that the most significant feature of mobile phone connectivity was its relevance to a region of a city, as it relates to one’s proximity to a cell phone tower, rather than a defined location in the urban grid. In addition, the boundaries of this area were often in flux, mediated by use patterns, geographic and weather conditions, electromagnetic noise, etc. For their research they, in turn, redrew the map of Helsinki according to this cellular structure.
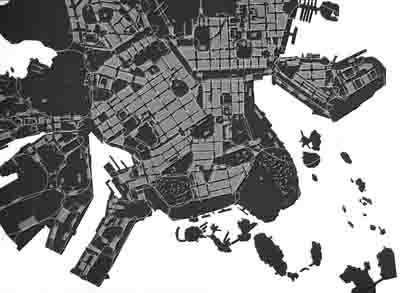
Figure 6. Cellular map of Helsinki. Ben Hooker and Fiona Raby, Project # 26765 – Flirt: Flexible
Information and Recreation for Mobile Users (Art Books International Ltd: London, 2000).[35]
Although Hooker and Raby’s map articulates the general block plan of the city, it contextualizes the permanent urban fabric within cells of connectivity, effectively rezoning the city based on the range of mobile phone towers. However, the map could be further developed to incorporate time. The network fluctuations they examined would show significant variation over the course of an hour or a day. This variance would have effects on the boundary conditions of the cells and thus reformat the city according to the dynamics of the network. As we create projects that reflect this variable terrain, the process of making them responsive to the erratic qualities of the technology will convey the evolving dynamic between corporeal and Hertzian landscapes.
The impulse to represent this fluctuating landscape again points to the possibility of developing base maps that incorporate time. Michael Batty argues for an urban theory that regards all urban phenomena as "spatial events."[36] Although some events may be measured in minutes or hours, for example a "flash mob,"[37] others may be measured in years or decades, a coffee shop occupying a specific storefront, for instance. In cartographic terms, long-term events may have a more constant presence and short-term events a more fleeting one, but all would be qualified by their durations. Introducing time to the base map will allow us to understand the spatial effects of temporal events, ultimately recognizing the ways in which both ephemeral and stationary phenomena shape the city.
Network
With cheap GPS chips being installed in most new phones, electromagnetic fields may increasingly relay information to us relative to our location in the city – including a variety of data from annotations logging associations with a place to current traffic delays and crime statistics.[38] These annotations may define and redefine the physical landscape as the meaning of places is shifted by the information attached to them.[39] Further, spatial annotation includes media that may be revised by the day, hour, or minute. In turn, our understanding of the city may become increasingly informed by temporary references. These changing references begin to undermine a purely geographic notion of urban space, suggesting an alternate mapping that visualizes a network of relationships based on proximity, signal, etc.
For example, as the London tube system grew in the 1930s, the early underground maps became difficult to read as new and expanded lines clogged the page. Harry Beck, a draughtsman working for the Underground, designed a new map in 1933 [Fig. 7] that dispensed with geographical accuracy to simplify the diagram.[40] As an alternative to the convention of the geographic map, he drew the lines of the rail as a network, inspired by the conventions of circuit diagrams he was familiar with as an electrical engineer. Despite being divorced from geographic location, the map has become an invaluable guide for passengers.
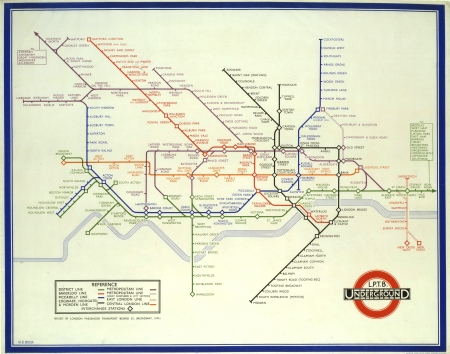
Figure 7. Harry Beck's 1933 map of the London Underground reproduced courtesy of
London’s Transport Museum. © Transport For London.
Similarly, as our orientation to the city shifts to include our proximity to ephemeral events – the broadcasts of ad-hoc networks, spatial annotations, and other ambient data – we will need maps that position us according to the transmissions around us, not just our geographic location.[41] The base map may, in turn, become increasingly fragmented, personalized, and interpretive – rendering space according to the relationships we construct in it rather than a geographic illustration of the city as a whole.
Conclusion
The contemporary base map references the purely static landscape of the city – defined by Cartesian coordinates, the road system, and the block plan. However, the city is an enormously dynamic mechanism, which incorporates variable patterns of movement, occupation, and density. As we develop strategies for creating collaborative maps by using locative media, we must also challenge the cartographic assumptions of the base map. This calls for a new form of mapping that represents the city as a temporal system, characterized by both transitory and enduring "spatial events." By referencing the city through the use patterns that shape it, the conventions of mapping will be transformed from those that depict urban structure to ones that amplify urban life.
New technologies, including database-driven maps and locative media, allow us to render geo-spatial data in diverse ways. These tools enable the creation of maps that are generated by an expanded vocabulary of metadata and are rendered using a variety of cartographic techniques that serve to emphasize the life of the city. Applying these innovations to the configuration of the base map will ultimately alter our orientation to the urban landscape as we respond to temporal events and their spatial effects. The fluctuating nature of the Hertzian landscape reinforces these dynamics, while simultaneously calling into question the traditional boundaries of the physical infrastructure. Perhaps by finding new ways to represent this evolving landscape, the city will come to be seen as a space that is modified by both material and invisible topographies.
Ultimately, the importance of geography itself may become increasingly irrelevant to the base map as our proximity to temporary references sets our bearings to the city. This may allow the base map to become a more interpretive device, framing space as a network of relationships rather than a strictly geographic hierarchy. By visualizing the city through this broader notion of mapping, we have the opportunity to experience the urban landscape in new ways, ultimately becoming aware of the changing practices that inform our notion of place.
A shorter version of this paper was previously published in ed. Marc Tuters + Rasa Smite, Acoustic Space: Trans Cultural Mapping (Riga: The Center for New Media Culture RICX, 2004).
Acknowledgements
This paper was written with the advice of Ryan Shaw who is currently collaborating with me on a project entitled TRACE (www.tracemap.net), generously supported by the San Francisco Exploratorium. Many of the ideas developed in this paper are the result of our work together.
References
[1] Giles Lane, Urban Tapestries, http://www.proboscis.org.uk/urbantapestries/;
accessed July 2006.
[2] Ibid
[3] Marina Zurkow, Julian Bleeker, Scott Paterson, and Adam Chapman, PDPal, http://www.pdpal.com; accessed July 2006.
[4] See Google Maps, http://www.google.com/maps; and MapQuest, http://www.mapquest.com/ for examples; accessed July 2006.
[5] U.S. Census Bureau, http://www.census.gov/geo/www/tiger/; accessed July 2006.
[6] Denis Cosgrove, “Carto-City” in Janet Abrams and Peter Hall (ed.), Else/Where: Mapping New Cartographies of Networks and Territories (University of Minnesota Press: Minneapolis, MN, 2006), p.148.
[7] See [6], Cosgrove (2006), p. 150-155, for a description of the celebratory relationship between maps and urban space common to 16th – 18th century maps versus their 19th and 20th century counterparts, in which regulation and legibility become most significant.
[8] Jean Baudrillard, Simulations (Semiotext (e), Inc.: New York, NY, 1983) p.2.
[9] Curator and artist Drew Hemmet defines locative media as media that “uses portable, networked, location-aware computing devices for user-led mapping, social networking and artistic interventions in which geographical space becomes its canvas." See his article "Locative Dystopia" (2004), http://www.drewhemment.com/2004/locative_dystopia_2.html; accessed July 2006.
[10] See Anthony Dunne and Fiona Raby, Design Noir: The Secret Life of Electronic Objects (Birkhäuser: London, UK, 2001).
[11] See examples of Mesh Neworks in Locust World, http://tinyurl.com/72xgn; accessed July 2006.
[12] Kevin Lynch, The Image of the City (1960), p. 2.
[13] Michel de Certeau, The Practice of Everyday Life (1984), p. 117.
[14] Michael Batty, "Thinking about Cities as Spatial Events," Environment and Planning: Planning and Design 129 no. 1 (2002), p. 1-2.
[15] For examples see Google Maps and Yahoo! traffic maps, http://traffic.poly9.com/; accessed July 2006.
[16] Reproduced in Alison Smithson (ed.), Team 10 Primer (The MIT Press: Cambridge, 1968), p. 53.
[17] Published in Stan Allen, Points + Lines: Diagrams and Projects for the City (Princeton Architectural Press: New York, NY, 1999), p.56.
[18] Michael Batty, "Thinking About Cities as Spatial Events," Environment and Planning: Planning and Design l29 no.1 (2002), p.1-2.
[19] Originally published in Bill Hillier, Space is the Machine (Cambridge: Cambridge University Press, 1996), p. 162.
[20] Esther Polak and Waag Society Amsterdam, "Realtime," http://www.waag.org/realtime/, accessed June 2006.
[21] Scott Snibbe and Stamen Design, Cabspotting, http://www.cabspotting.org/; accessed July 2006.
[22] See http://www.cabspotting.org/projects/flycab/; accessed July 2006.
[23] See [6], Cosgrove (2006), p. 152-3 for a description of 16th century maps.
[24] See Lalya Gaye, Ramia Mazé, and Lars Erik Holmquist, “Sonic City,” http://www.viktoria.se/fal/projects/soniccity; accessed July 2006.
[25] See Simon Sadler, The Situationist City (The MIT Press: Cambridge, MA, 1998), p. 15-66.
[26] Reprinted in Simon Sadler, The Situationist City (The MIT Press: Cambridge, MA, 1998), p. 60.
[27] Although they do not yet challenge the base map this data is projected upon, several recent projects collect this kind of data. See Christian Nold, “Biomapper,” http://www.biomapping.net, accessed July 2006; Giles Lane and Natalie Jeremijenko, “Robotic Feral Public Authoring,” http://socialtapestries.net/feralrobots/, accessed July 2006; as well as Ben Hooker, Pedro Sepulveda and Bill Gaver, “Environmental E-Science,” http://www.dataclimates.com, accessed March 2006.
[28] See urban planner Anthony Townsend's project New York City Wireless, http://www.nycwireless.net, accessed July 2006.
[29] Ben McGrath's article discusses Mayor Michael Bloomberg's efforts to rid Manhattan of its “dead zones.” Ben McGrath, “Call Log: I'm Loosing you,” The New Yorker, Nov. 10, 2003, pp. 48-50.
[30] Bluejacking is the action of sending an unsolicited message over a cell phone, PDA, or laptop via a blue tooth network. See Wikipedia, http://en.wikipedia.org/wiki/BlueJacking; accessed July, 2006.
[31] See services like Socialight: The World in your pocket, a website that interrupts your journeys through the city with “StickyShadows” left there by other users, http://socialight.com/; accessed July, 2006.
[32] William Mitchell, Me++ (The MIT Press: Cambridge, MA, 2003), p. 120. William Mitchell points out in his book Me ++ that “The most profound effect of electronic tracking, inscription, and interrogation techniques is, in combination and on a large scale, to change the fundamental mechanics of reference – the ways in which we establish meaning, construct knowledge, and make sense of our surroundings by associating items of information with one another and with physical objects.”
[33] James Corner, "The Agency of Mapping" in D. Cosgrove (ed.), Mappings (Reaktion Books: London, 1999), p. 213-14.
[34] Ben Hooker and Fiona Raby, Project # 26765 – Flirt: Flexible Information and Recreation for Mobile Users (Art Books International Ltd.: London, 2000). See also Ben Hooker, "Dataclimates," http://www.dataclimates.com; accessed March 2006.
[35] Ben Hooker, "Dataclimates," http://www.dataclimates.com, accessed March 2006.
[36] Ibid. [14], p. 1.
[37] See Wikipedia, Flash mob, http://en.wikipedia.org/wiki/Flash_mob; accessed July 2006.
[38] For more on the implications of GPS systems on urban design see Anthony Townsend, “Digitally Mediated Urban Space: New Lessons for Design,” Praxis, March 2004, pp.100-05.
[39] See Jo Walsh's “SemanticCity” for a discussion about the semantic web and its relationship to our experiences of urban space, http://frot.org/bus/wiki.cgi?SemanticCity; accessed July 2006.
[40] London's Transport Museum, http://www.ltmuseum.co.uk; accessed July, 2006.
[41] There are several recent cell phone projects with location-based interactions, such as Dens Crowley's and Alex Rainert's Dodgeball, http://www.dodgeball.com, accessed July 2006; and Kamida's Socialight, http://www.socialight.com; accessed July 2006.
|